This event took place in partnership with Meta in London on the 1st of October 2026. If you couldn’t make it, here is what each speaker covered.
Introduction to the event, hosted by Liam Wade
The session opened with a chess story.
In 1996, renowned chess grandmaster Gary Kasparov beat IBM’s Deep Blue supercomputer in a human vs machine chess match.
Later, in 1997, Kasparov lost to IBM’s upgraded Deep Blue supercomputer in 1997, becoming the first computer system to beat a chess grandmaster.
In 2005 at the PAL/CSS Freestyle Chess Tournament, a team of two relative amateurs utilising three ordinary personal computers shocked the chess world by defeating grandmasters and supercomputers.
The victory became a foundational case study in human-machine collaboration. This is because they had a better process for deciding when to trust the machine.
Meta’s AI is now available to every advertiser, so the edge comes from how you work with it: The signals you feed it, the creative you give it and the way you measure the result.
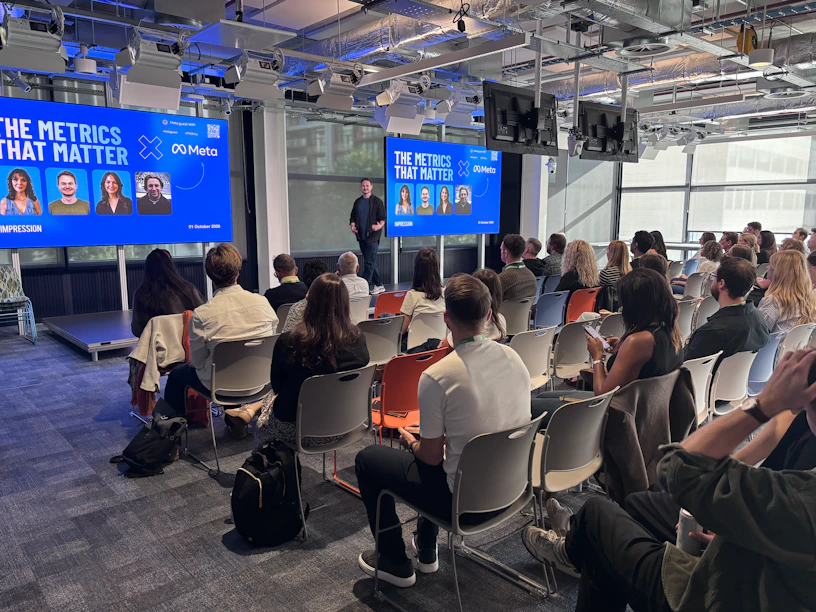
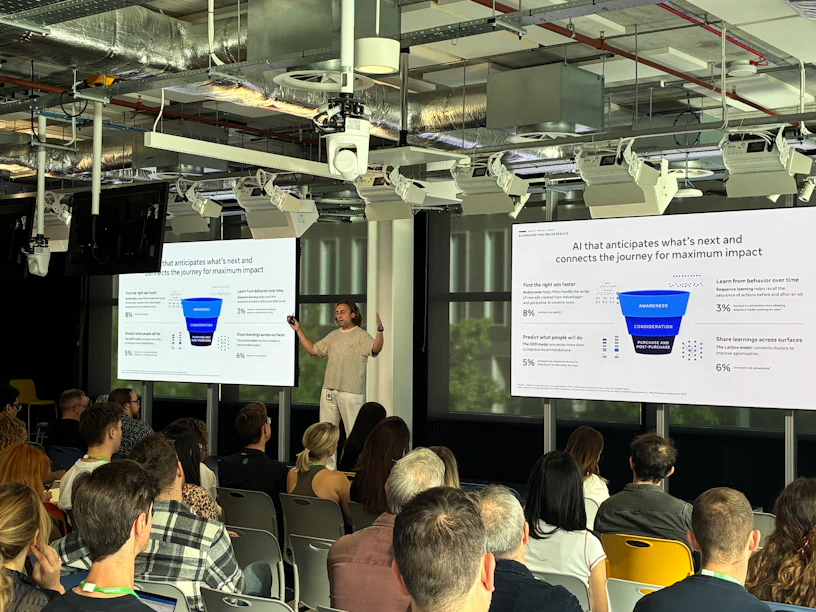
Meta keynote: The next era of performance
Speaker: James Powell, Agency Solutions Manager, Meta
James discusses how Meta’s AI now powers ad retrieval, prediction, and optimisation, and that a global test found that Advantage+ sales campaigns delivered 20% lower cost per result.
As Meta AI becomes a place people discover products, your catalogue, organic content and measurement setup determine whether your brand shows up. New tools include Advantage+ background generation, a Meta AI business assistant (beta) called Muse, and ads AI connectors built on Model Context Protocol (MCP).
Takeaway: The constraints of cost, speed and quality are falling away, so the advantage comes from the signals and creative you feed the system.
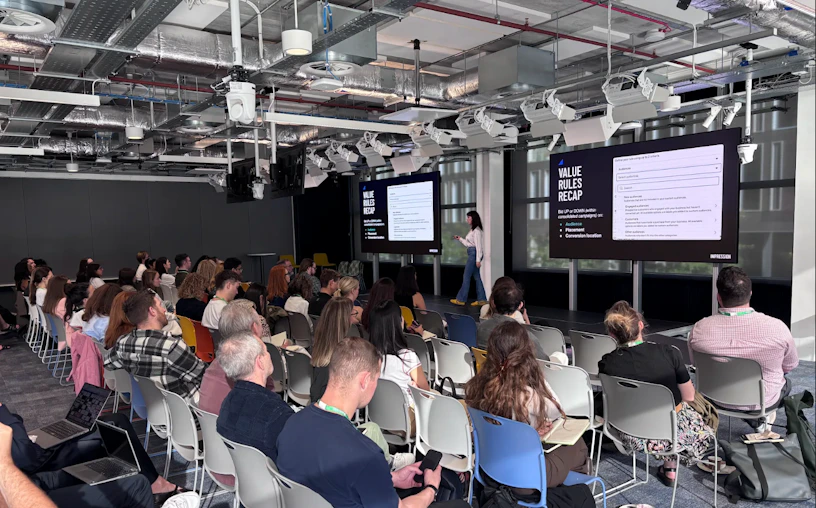
Beyond the black box
Speaker: Amy Stamper, Head of Paid Social, Impression
Consolidated Advantage+ structures don’t mean giving up control of who you reach. (Read the case study)
The three levers that matter:
Audiences and structure
Label your audiences, add segment breakdowns to BAU reporting to see where Meta is spending, then use value rules to bid up or down by audience, placement or conversion location. Use them when you hold information Meta doesn’t, such as valuing new customers over existing ones at the same basket value.
Bidding for the metrics that matter
Pass profit margin data back via Conversion API (CAPI )to optimise for profit on ad spend. Tests predicted lifetime value (5+ distinct values, a 3x spread, signal within 7 days, and willingness to accept higher CPAs), and validate incremental bidding with a two-cell lift study.
Creative as targeting
Andromeda can serve hundreds of ads per advertiser, so start with what each persona cares about (first-party data, surveys, reviews, social listening), turn pain points into concepts and hooks, and tag every asset to see which personas win.
Winning brand attention outside the social feed
Speaker: Harriet Fitzgerald, Head of Programmatic, Impression
It takes about 2.5 seconds of active attention to encode a memory, yet 85% of video ads miss it. Off-feed video such as CTV is lean-back and sound-on, with around 30 seconds of view time and 90% average completion (35% for social video), so it encodes the memory. Priming then cuts the attention Meta’s in-feed video needs from 2.5 to 1.5 seconds, a 40% reduction.
The hold and the hook
Off-feed video holds attention and tells the full story (a charity client used CTV for the story arc), then the in-feed hook triggers that memory and stops the scroll. Branding, narrative and tone must link the two.
Guardrails
Prioritise high-attention formats, ensure the brand is recognisable across formats, aim for 2-3 exposures per week, and use broad audiences to feed Advantage+.
Prove it
Run a geo split of Meta only against Meta plus off-feed video, and track AVOC, hook rate and blended CPA. Combined with TV, the brand Heineken saw a 22 point lift in incremental brand awareness and Intersport 2.6x brand metrics, as an example.
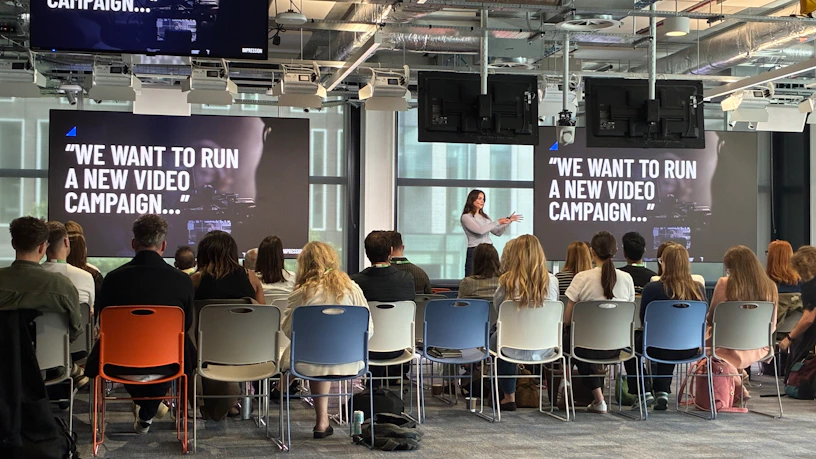
Proving and acting on what drives incremental growth
Liam Wade, Chief Strategy Officer, Impression
Even if you switched off all advertising tomorrow, you would still make sales. Platforms credit campaigns on correlation, so their claims can add up to more than 100% of revenue, and over-reliance on attribution leads to a performance plateau. Incrementality shows what your marketing actually caused.
Liam explores this in a case study for airline Norse Atlantic Airways
Norse Atlantic Airways case study
Platforms attributed over 50% of revenue and GA4 under 5%, but a multi-cell geo-holdout test found a 27% incremental contribution to total revenue, with high statistical confidence
Liam then showed how Impression turns measurement into action with the Find, Fund, Protect framework, used to cut media spend and scale revenue:
- Find: Use incrementality tests to spot spend that platforms over-attribute, or where you are over-indexed against competitors, then diversify that spend. A nationwide B2B retailer’s 8-week brand PPC pause showed zero incremental revenue and an estimated 175k in annual media spend saved
- Fund: Look for channels that are under-attributed, or where you are under-indexed against competitors, and increase spend there. A 2-week YouTube test for a lead-gen client drove 800 incremental MQLs and a 176% jump in brand searches
- Protect: Find and Fund are one-off moments, so Protect is what sustains growth. Keep testing, track long-term brand effects, then re-test and reallocate. Three rules apply: results decay as the economy, competitors and algorithms change; one test gives one result at one spend level, so map saturation; and incrementality data has limits against long-term effects, so over-relying on it is as risky as over-relying on attribution
Three things to do next
- Check which audiences your consolidated campaigns are really spending on, and pass profit or lifetime value data back via CAPI
- Pair off-feed video with your Meta activity and run a geo-holdout test to prove the effect
- Ask when you last seriously questioned your media performance assumptions, and test before you cut or scale budget
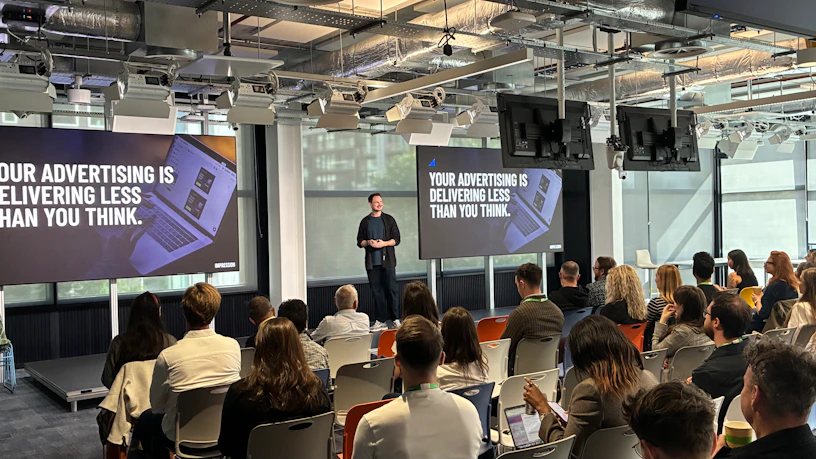
Want to talk it through?
We offer The Signal & Scale Check: a 20-30 minute call reviewing your Meta signal health (CAPI, first-party data, value-based bidding) and creative diversity, followed by a short visual one-pager. To book one, get in touch.