Google’s Tag Assistant Chrome extension lets a user see what tags are being used on a page and will report back on any issues found with implementation. This extension whilst simple on the surface can be an invaluable tool when it comes to any problems with your analytics, tag manager or remarketing tags.
As code becomes more and more affected by JavaScript running after the initial load it isn’t enough to just look at the source code, using extensions like Tag Assistant helps us view the tags after all the scripts have loaded in.
This article will help you understand the basics of Google Tag Assistant and dive into more in-depth concepts such as recordings and how to diagnose problems with complex analytics installations.
Getting started with Tag Assistant
To install Tag Assistant Legacy click here.
Once the extension has been installed and you’ve launched a web page you will see a happy little tag with a smile on its face.

If you click the face it will a launch a dropdown which will say the tab is currently inactive, you will need to click on the blue ‘enable’ button to being tracking and then refresh the page.

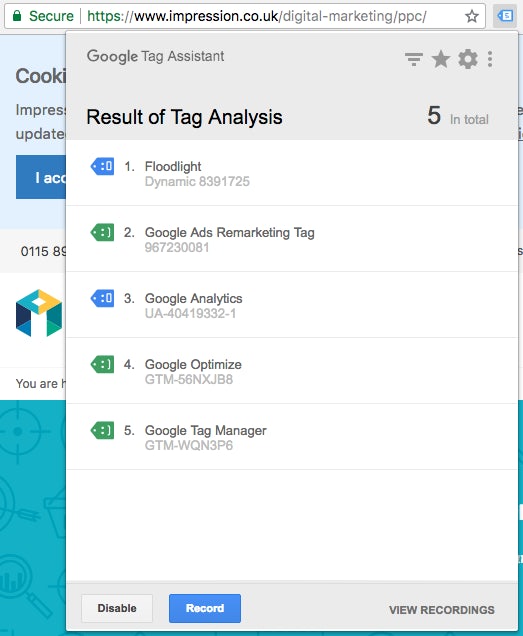
When you’ve reloaded the page the tag icon will be replaced by the numbers of tags which the assistant has found, this will typically between 2-4. Clicking on the icon again will give a dropdown list of these tags, their ID’s and highlight any issues. The current tags which can be tracked by Tag Assistant are:
- Google Analytics (ga.js)
- Google Analytics (dc.js)
- AdWords Conversion Tracking
- AdWords Remarketing (legacy)
- AdWords Remarketing (new remarketing tag)
- Doubleclick Floodlight
- Google Tag Manager
Next to each tag you can see a different coloured tag accompanied by a face, these are a visual indicator of the health of a tag
| Colour | Face | Meaning |
|---|---|---|
| Green | Happy | This indicates everything is as it should be, the tag is working correctly |
| Blue | Surprised | Indicates a tag which is functioning but has scope for optimisation due to a non-standard implementation |
| Yellow | Tongue | A minor issue that should be fixed when you can |
| Red | Confused | This indicates a major issue with the tag and must be fixed as soon as possible |
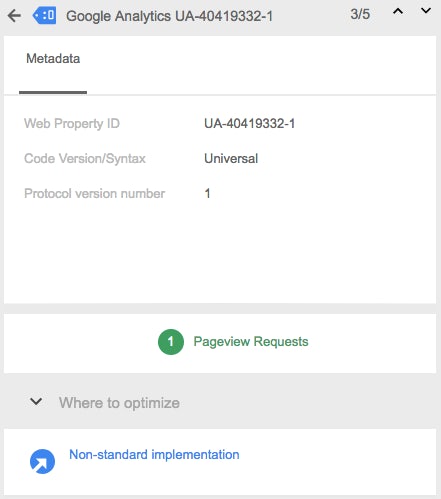
You can click on each tag to find out further information:

Looking at an Analytics tag you can see the property ID, find out more about the version along with being able to click into the Pageview requests to pick out what’s being passed over to Google Analytics.
Common Google Tag Assistant issues
Now we know the basics of how to use the extension let’s look at some common issues:
No HTTP Response Detected

This is a common issue where the extension detected the scripts in the page source but the script itself didn’t execute. Some of the most common reasons why this could happen and things to keep an eye on are:
- The namespace for ‘ga’ is already defined by another script, this will block the JavaScript firing.
- Other Chrome extensions blocking the script from firing, if you methodically turn off each of your extensions you will be able to find the culprit.
- If you’re using CMS plugins to install your analytics then these will commonly use a different JavaScript namespace. Make sure whenever carrying out analytics work that you’re matching up with namespace as this will causing HTTP response issues.
Multiple Google Analytics Tags Detected

The extension has found multiple tags installed on the page, this will cause double tracking issues if they are duplicate codes. To fix this you will need to only serve a single version of each tracking code for the website.
Invalid or missing web property ID

This error indicates that the code you’ve implemented is using a property ID that’s wrong or doesn’t exist. You will need to go into your analytics or tag manager and make sure that you’re using the correct code.
Code found outside of <head> tag

The tracking tag has been implemented outside of the head, this reduces the likelihood that the script will load before a user leaves. Make sure that you’re following best practice and firing the script in the head of your website.
These above issues are a few of the most common, to find a fully comprehensive list you can go the Google support website which has a full list alerts.
Tag Assistant recordings
Tag Assistant lets you record a journey through a website, this helps us drill down exactly what’s being passed over and gives is a full overview of how our website is sending data to the Measurement Protocol. This includes tags, events and any other interactions for ANY series of pages you visit (one website to another).
Why Use Tag Assistant recordings?
- Gives a full overview of all information being passed over to the measurement protocol
- Helps diagnose analytics issues such as double sessions, multiple page views per page and conversions not firing
- If you’re building a custom analytics implementation it acts as a tool for the developers to test their work
- Helps you track a users journey to understand attribution issues, for example, if a user has clicked through a paid ad then you can make sure from landing to check out, that your attribution is on point.
How to use Tag Assistant recordings
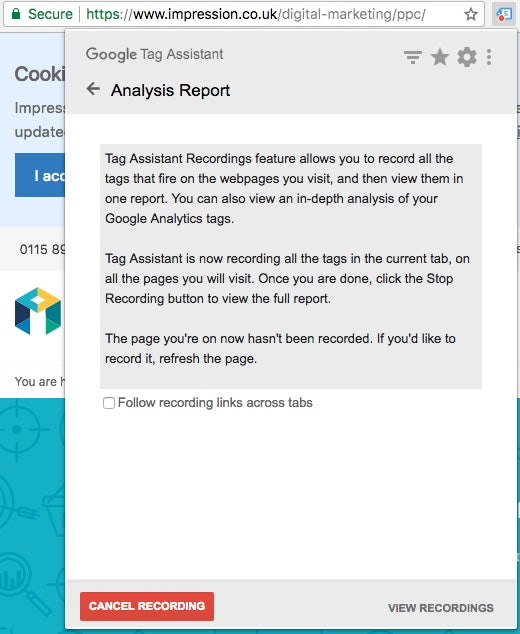
When you’ve loaded a website you will need to click the big blue ‘record’ button which will give a red dot on your extension bar, Tag Assistant is now recording your EVERY move on the website. If you click through your own website and a couple of others you will have gathered data.

At this point you get to see an overview of the recording and dive into the report:
When clicking on ‘Show Full Report’ your browser opens a new tab, these are split into two sections.

- Tag Assistant Report – This shows all of the tags that have been fired on the page visited during the recording. This section isn’t the meat and bones and acts as more of a resource to refer to when understanding all the tags which have been fired throughout the user’s journey.
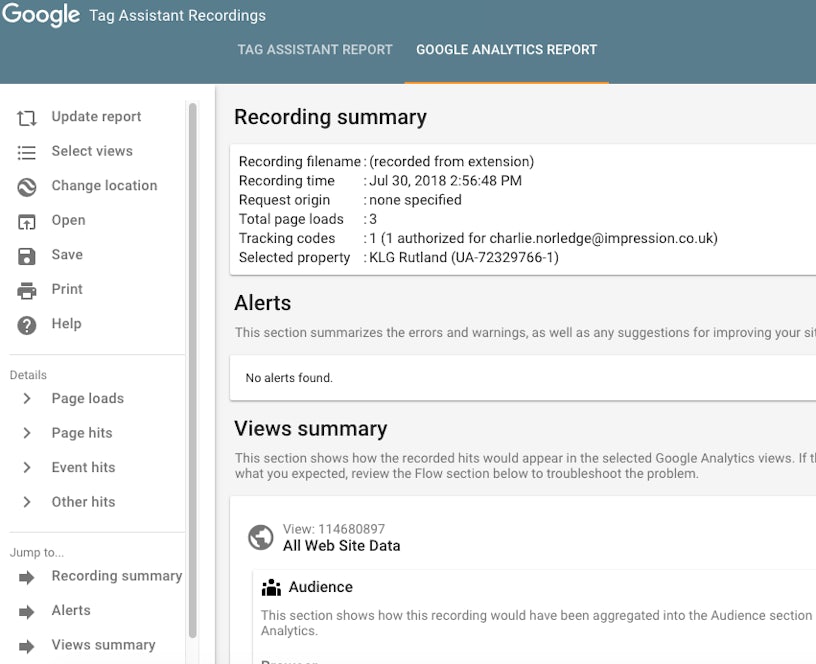
- Google Analytics Report – This shows how the data would have been passed over to the Analytics implementations. You select from different properties and views to review your Analytics. This is where you will find the measurement protocol data and can analyse any issues.
Using Google Analytics report tab
Once you’ve completed a recording and open the full report review you can click on the “Google Analytics Report”, the first thing you will be faced with is a choice of what view to use for your analysis. Note: You MUST have permissions within the analytics property to be able to view the data that’s contained in this report.
Once you’ve chosen the view you wish to analyse, you are faced with a dashboard which contains the following property information:
- Recording Summary – Gives a general overview of the current recording such as time an date, page loads and tracking time
- Alerts – This highlights any problems found within the recording, Google has a great resource for common issues which can be found here
- View Summary – This is an estimation of how your analytics profile would have reported on the recording you’ve just made. As this is only an estimate it doesn’t reflect the true data passed over to your analytics profile
- Flow – This is the critical part of the report, it displays all of the pages loaded into the recording along with their hits and interactions. This is where you can start to diagnose any issues which should be immediately obvious from this flow not representing the recording you’ve just made

How can I analyse these Google Tag Assistant recordings?
Here are some common issues which arise in these reports and how you can spot them.
Additional Sessions
This can occur when moving from a sub-domain to your main domain, for example:
Shopping.impression.co.uk redirects to the main domain once a user has added something to the cart, this may cause a duplicate session. This would be flagged up in the report and we would need to include a referral exclusion to solve this issue.
Long load time
This is where the script is taking a long time to fire, this is a good indicator that your page is slow along with the scripts possibly not firing in the correct order.
Long load times lead to higher bounce rates and reduced conversions, making sure that all of your scripts are loaded in the correct order and the page is fast will remedy this issue.
Losing GCLID
The GCLID is the auto-assigned id when coming through your paid ad campaign, if this ID is being lost or messed with your acquisition data will be incorrect and might be coming through as direct in Analytics.
This is a common issue that we see but has to be investigated on a case by case basis by a development team. Having this identified in the Alerts section is the perfect place to start when looking to solve this issue.
Takeaways
- Every SEO should have this installed, diagnosing Analytics issues as they arise is much better than 3 months down the line
- Become familiar with how Tag Assistant recordings work so you can solve analytics issues
- With the web becoming more and more script dependant this extension offers a way to review tags once they’ve been implemented and affected by other scripts
Every digital marketer and developer should have this extension installed by default, if you’re making decisions based on analytics data or creating applications that use this data then it’s essential. We’ve used this extension across many of our clients and it’s helped us diagnose and solve issues that aren’t immediately obvious from the source code or analytics.
For further tips and advice on technical analytics, check out our measurement and analytics blog. If you have any questions about Tag Assistant and require further support, feel free to reach out to us.


