
Standard Meta Ads reporting traditionally stops at the ad level, leaving e-commerce brands in the dark about which specific products are actually driving traffic on social platforms. While Dynamic Product Ads (DPAs) are incredibly powerful, they aggregate performance across multiple items, making it difficult to isolate individual product success.
To bridge this data gap, the team at Impression has developed a robust reporting solution that integrates Meta’s product insights metrics extracted directly from the Product Insights API with granular Catalog data for our e-commerce clients.
Amy Stamper, Head of Paid Social at Impression, has already written a blog about the context behind this method (we suggest reading it first!) This approach allows us to track performance by product name, ID, and category, offering the exact transparency required to optimise large-scale dynamic campaigns.
Marketers should use this data to understand performance, digging into which products Meta is prioritising and which ones users are actually clicking. This data is then fed back into a supplementary feed to enrich your Meta Catalog, driving a continuous loop of performance improvement.
This level of insight is essential for brands looking to move beyond surface-level metrics and truly understand the core drivers of their social media performance.

How to build a Meta Product-Level Report
Meta product-level reporting involves pulling data directly from the Meta Catalog API and joining it with the Product Insights API.
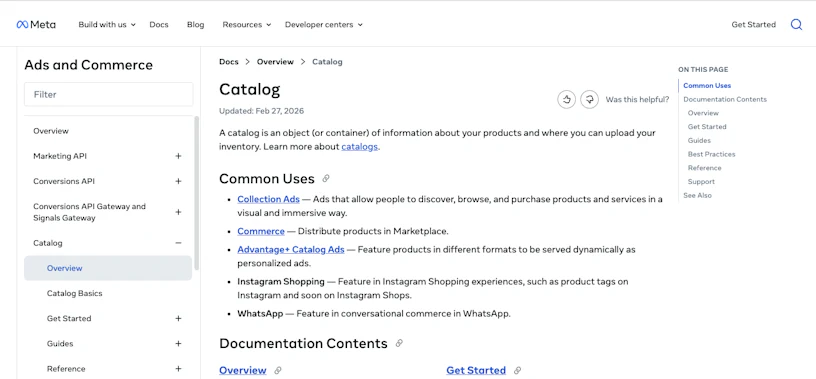
This will create a unified view that tracks impressions, clicks, and spend from product insights, alongside product attributes like price, availability, and category from the Catalog data. This granular visibility is essential for e-commerce brands, where product taxonomy and stock levels change daily.
Case Study: Looking at this in practice
Let’s imagine you are a fictional e-commerce clothing brand, and want to outline how you can evaluate your products.
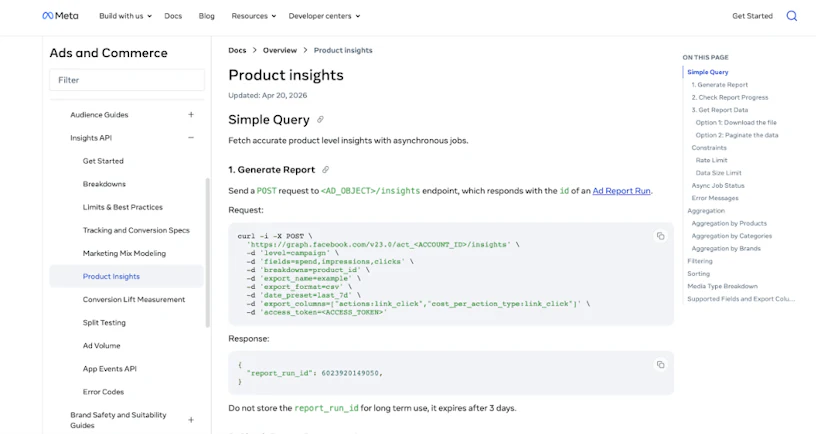
First, you need a system (asynchronous workflow) that processes data in the background so you can handle large amounts of product feedback without slowing things down. In a baseline setup, you can extract core metrics: spend, impressions, and clicks from the Product Insights API. You can use these metrics to calculate CPC, CPM and other derived metrics at the item level.
Then you blend with catalog data to track performance by product name, product type, and category. As catalog data occasionally returns only raw category IDs, we map these against Google Product Category data to identify precise categories—such as:
Clothing > Tops > T-Shirts > White T-Shirts.
You can also group items into specific product buckets.
For example, isolating “White T-Shirts” might reveal significantly different engagement rates compared to “Pink T-Shirts,” directly informing future creative strategies and budget allocation. To achieve this view, you extract the final element of the Product Type string from the catalog data. From the full string like:
“Clothing > Tops > T-Shirts > White T-Shirts” to “White T-Shirts”
For clothing brands, things like colour, availability, and price heavily impact performance. We pull this data straight from the catalog table into the report, so the team can easily see how different groups of items are performing.
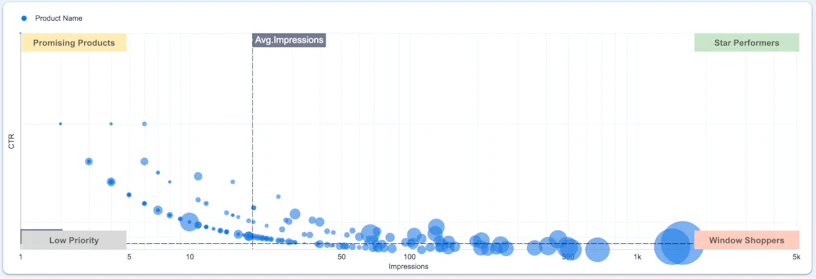
Using this unified dataset, you can build visualisations such as scatter plot charts to present exactly which quadrant each product falls into.
This allows you to instantly identify high-impression, high-CTR “star performers” that deserve more budget, as well as low-performing laggards that should be excluded from the feed. A similar view can also be achieved at the product type level.
“Our goal is to provide a dashboard that isn’t just a report, but a diagnostic tool for both our client and paid social team.”
Alex Howat, Associate Director of Media Solutions at Impression
Future iterations: Attributed revenue
Since Meta removed conversion metrics from the Product Insights API, the next frontier involves even more sophisticated attribution. Our next phase introduces a layer of Google Analytics 4 (GA4) data to estimate revenue and identify exactly which products are converting into sales. More context on how we join with GA4 data can be found here.
Ready to de-risk your Dynamic Ads?
Our Meta Product Performance report provides the clarity needed to scale ecommerce accounts with confidence. Whether you are troubleshooting catalog errors or looking for your next best-seller, granular data is the key to success.
If you are ready to see what’s really happening inside your Dynamic Product Ads, speak to our analytics team today.

