When performance shifts, the “why” isn’t always simple to pinpoint. While we’d love to always credit a specific metadata tweak or cannibalisation issue for changes in performance, the reality of search is often a complex web of external factors, technical nuances and shifting user behaviour.
Failing to account for these hidden drivers doesn’t just lead to incomplete reports; it erodes the trust of your stakeholders.
The team at Impression has pulled together a collection of often-overlooked insights to help you dig deeper. These tips will help you move beyond the ‘what’ and master the ‘why’ – allowing you to tell a more compelling story and secure the buy-in you need.
- Stay vigilant of paid vs. organic cannibalisation in SERPS
- SERP features can contribute to zero-click searches
- Intent pruning and prioritising conversion over top-of-funnel reach
- Connecting social ‘push’ to search ‘pull’ with linguistic trend mapping
- Don’t ignore informational content value when 54.4% of UK searches are now zero-click
- Finding "hidden" value in Google’s free shopping listings
- Check that low-quality legacy pages aren’t holding back the performance of your other content
- Account for Amazon Prime Day and other Amazon sales throughout the year
- If you’re optimising for the B2B space, don’t dismiss Bing as part of your strategy or reporting
- Check for leaks in user experience if traffic is stable but sales drop
- Don’t forget about last year’s promotions when comparing the year vs the previous year
- The weather could be the reason behind a sudden spike or a sudden drop in sessions and revenue
- If sessions are looking extremely good - check it’s not too good to be true
- Final thoughts
Stay vigilant of paid vs. organic cannibalisation in SERPS
To really optimise website content for the SERPs, it’s important to ensure that paid media teams are working closely with the SEO team to ensure that ads are not running where SEO already succeeds in too many cases.
Whilst taking up real estate in the SERPs is a positive thing – and having your brand in both paid and organic listings can help foster brand confidence and trust (especially now with paid ads taking up more room and being harder to distinguish from organic listings!) – it’s worthwhile keeping an eye on how much the ad clicks could be costing you if you’re already ranking in position 1 for the same keywords.
There have been many websites that have had a drop off in clicks (especially for homepages) – as users tend to be more likely not to care about whether they click on an ad when they’re already confident with the website they’d like to land on. However, if they are searching for your brand specifically, they’re likely to click the organic listing if an ad isn’t present.
In a specific example where this has been the case, we pulled together the correlation between organic branded clicks going down on the homepage and paid ad spend on branded keywords associated with the homepage (and subsequently clicks on those ads), increasing almost perfectly in line.
So, if you’re losing clicks to your homepage, and have checked various other factors, e.g. seasonal demand, pausing/reducing social media content, SERP feature changes etc, then it’s worth reviewing with the paid media teams to ensure the right balance of ads are in place where organic listings are performing well and are visible right at the top of the SERPs (that part is vital!). It could be ads stealing your organic clicks!
Takeaway:
It’s useful to run a test here and see what performance changes happen – rather than committing to lots of big changes straight away. Ads should only be paused if the organic result is visually dominant (not pushed down by AIOs/ads) and usually has a high CTR.
In cases where it’s actually SERP feature cannibalisation, see below.
SERP features can contribute to zero-click searches
Ranking #1 has traditionally always been the ultimate goal, but ranking in 1st position does not always mean you’re guaranteed clicks.
If you notice that clicks are starting to decline, despite high rankings, look at the actual search page layout. Google might have dropped a “People Also Ask” block, a product grid or an AI overview right on top of you – the latter, contributing to the ‘zero click’ phenomenon. You’re still technically the first blue link in the organic list, but visually, you’re much further down. Since we can’t rank higher than #1, we have to pivot.
Recent data pulled together by Aleyda Solis shows that paid results have nearly doubled their click share in some places, forcing brands to buy back visibility they previously earned organically. To adapt, businesses should stop treating this as just an AI problem and instead diversify their presence by investing in high-growth organic areas like YouTube, Reddit and brand-building.
Additionally, it’s worth looking at what SERP features are present and evaluating what you can do to show up in those spaces, too. For example, ensuring total data alignment between your Google Merchant Centre feed and on-site Product Variant structured data, while focusing on descriptive product titles and competitive factors like price and shipping policies to help increase visibility in product grids
Callum Lockwood on Majestic’s podcast series SEO in 2025/2026 offers some helpful advice on how to increase visibility on product grids.
Intent pruning and prioritising conversion over top-of-funnel reach
Traffic counts can lie to you. If you update a guide and see clicks drop while sales rise, you’ve still succeeded. Moving big batches of content production from excessive, broad “top of funnel” to specific “middle of funnel” answers scares off the window shoppers but keeps users with a higher buying intent
You can diagnose “TOFU bloat” by auditing your top-trafficked pages; if your most popular guides contribute zero to your conversions or pipeline, you may have prioritised reach over resonance. Whilst content from all stages of the funnel is vital, too much TOFU content, without considering other stages of the user journey (MOFU and BOFU), could affect your bottom line.
So if your vanity metrics, such as sessions, are dropping as a result of changing your strategy here, investigate whether this is really a ‘bad thing’ by taking a look at conversions on your new or optimised MOFU content.
Connecting social ‘push’ to search ‘pull’ with linguistic trend mapping
Search is the pull that follows the social push. TikTok creates the feelers (e.g. Fisherman-core), but Google handles the utility (e.g. Green Vests). People don’t always search for the trend name – they search for the components required to replicate it.
In your reporting, you should move beyond static keyword volumes to track demand translation, specifically monitoring how social media shifts correlate with surges in descriptive, unbranded nouns and an expansion of unique long-tail queries. Instead of just tracking the trend name (e.g. “Fisherman-core”), audit the “Halo Effect” by measuring the growth in search surface area – where a single category page begins ranking for a higher diversity of aesthetic-related terms.
By cross-referencing internal site search data with Google Search Console, impressions for “zero-volume” keywords (terms too new for SEO tools to catch, which represent the bleeding edge of consumer trends), you can prove to clients and stakeholders that you are capturing real-time human intent before the competition even identifies the trend
Translate the Trend: When a trend like “Quiet Luxury” or “Fisherman-core” spikes, don’t just optimise for the keyword. Create a “Trend Map” – e.g.
- Social Term: “Coastal Grandmother”
- Google Search Term: “White linen button blouse,” “Straw sun hats,” “Ecru cashmere jumper”
If you have a blog post about a trend, link it directly to the category pages that actually house the products. This bridges the gap between the user’s inspiration and their purchase.
Don’t ignore informational content value when 54.4% of UK searches are now zero-click
With more customers using AI to start their search journeys, we’re seeing a common theme: informational content is experiencing consistent click losses. This is because users are getting their answers elsewhere, whether that’s via YouTube, ChatGPT or Google’s AI Overviews.
While it’s tempting to ask, “What’s the value of this content?” if clicks are down, that’s short-sighted. This content remains vital for supporting your primary keywords and, crucially, driving your brand’s visibility within AI-generated search results.
I recommend setting up AI visibility tracking to communicate the value this content delivers across the wider search landscape. At Impression, we’re currently using tools like Ahrefs and Otterly to help clients report on this “invisible” reach.
Finding “hidden” value in Google’s free shopping listings
Google Shopping’s free listings have exploded over the last 12 months. They now appear across the vast majority of e-commerce results and look almost identical to the paid shopping experience. By leveraging your Merchant Centre feed and structured data, you can drive high-intent revenue that simply appears as “organic” in GA4.
To check your eligibility and start reporting on this specific win, I’d recommend:
- Audit your feed
Ensure your Merchant Centre feed is healthy and that your product structured data validates correctly. - Isolate the data
In Google Search Console’s performance tab, add the “Merchant listings” search appearance filter. This helps you identify the specific keywords and product pages driving this performance. - The Narrative
Report on these metrics monthly to show how you’re winning “ad-like” space on the SERP without the CPC cost.
Check that low-quality legacy pages aren’t holding back the performance of your other content
If you’re working on a large site (like a large e-commerce clothing site, for example), sometimes you have to kill parts of your site to save the rest. Deleting hundreds of low-value, low-quality pieces of content, like old tags or expired promos, usually causes a temporary traffic dip, but we often see money pages start to climb. This is about crawl efficiency – because you’re forcing Googlebot to stop wasting time on pages with no value and focus on the pages that make you money.
In large-scale e-commerce, thin content usually hides in these three places:
- Thousands of URLs created by color/size/price filters (e.g., …/lamps?colour=grey&size=xl&price=low).
- Legacy tags like “Summer 2019” that have three out-of-stock products.
- Internal search results – where your site search pages are indexable, they are likely eating your crawl budget.
Run a crawl (e.g. Screaming Frog, Sitebulb or Lumar) and map it to your analytics. Any page that has 0 clicks, 0 conversions, and 0 backlinks over the last 12 months is your primary candidate for removal.
Account for Amazon Prime Day and other Amazon sales throughout the year
If you sell your products both on your own site and via Amazon, it is very normal to see a site-side revenue dip during Prime Day. Shoppers aren’t necessarily ignoring your brand – they’re just chasing the convenience of their Prime membership. They see your product on your site and then jump to Amazon to check for a lightning deal or free next-day shipping.
It isn’t necessarily a failure of your SEO – it can just be as simple as users shopping around for the best deals.
In the meantime, it’s useful to map events like Prime Day out ahead of time and provide your own unique incentives for buying directly from the site, e.g. free gifts with purchase, discounts and other perks to help offset any dips you see around Amazon Prime Day.
If you’re optimising for the B2B space, don’t dismiss Bing as part of your strategy or reporting
B2B software clients often see a surprising amount of traffic from Bing compared to their B2C counterparts. I find the reason is largely environmental. Most corporate environments run on Windows PCs, and as such, Microsoft Edge and Bing are the default browser and search engine.
Decision makers in these industries will likely be researching solutions to problems whilst in the workplace – meaning they’ll likely end up using Bing.
Whilst Bing and Google have their similarities and well-optimised content, they should, in theory, perform well in both search engines; there are some slight differences and tips to take away here to open up your website entry points. For example, Bing places a distinct premium on domain age and multimedia quality, rewarding sites that offer high-resolution, visually rich assets and clear, fact-based content structures that are easily extractable by AI.
Additionally, the AI Performance Report in Bing Webmaster Tools is really helpful to align your content with grounding queries, which are the specific phrases Microsoft Copilot uses to retrieve and cite sources.
Check for leaks in user experience if traffic is stable but sales drop
When sessions stay high but sales drop, your user journey might have developed a “leak.” This often happens after a site update or a change in calls-to-action (CTAs). I look at the bounce rate and “add-to-cart” ratios to see exactly where the friction starts.
If users are still adding items to their baskets at the same rate but failing to check out, the issue is likely something like a new shipping cost or a broken payment gateway. If they aren’t even getting to the add to basket stage, the messaging or UX on the landing page is likely the culprit. This is where talking to CRO teams is important (where applicable).
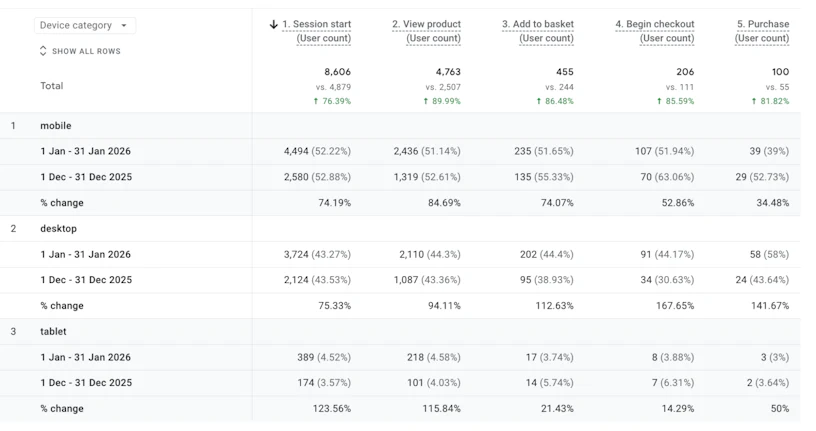
You can check how often your items are added to the cart within the ‘monetisation’ section of GA4 and see helpful graphs and comparisons.
For example, this ‘purchase journey’ section shows the stages of the buying process and allows me to see changes in user behaviour compared to a previous date range, including steps such as ‘add to basket’ and ‘begin checkout’.
Don’t forget about last year’s promotions when comparing the year vs the previous year
Year-on-year data can be deceptive if you forget last year’s incentives. A massive revenue drop despite stable traffic often traces back to a lapsed promotion.
If you ran a “20% off” flash sale or a “Buy One Get One Free” deal last June, today’s full-price numbers will naturally look weak by comparison.
It’s helpful to check with the internal teams to see if we’re currently fighting against the memory of a previous discount. Without an active hook, users may simply be waiting for the next deal to drop.
The weather could be the reason behind a sudden spike or a sudden drop in sessions and revenue
One of the biggest factors I faced when working for an outdoor furniture client was, of course, the weather. A sudden cold snap in April can kill demand overnight, or a really hot week in September could see sales surge. After many years of experience working on this website, I knew if our year-on-year data ever looked “off,” then a quick check of the local weather archives was in order. This allowed me to ensure that any drops or increases when comparing to the previous year were fairly accounted for.
Helpful tools for looking into this include Wunderground – look into major regions across the country(or countries) that the business operates in, and has seen large upticks or drops in traffic and then draw on any weather themes that could have affected sales in both the previous year and the current date range.
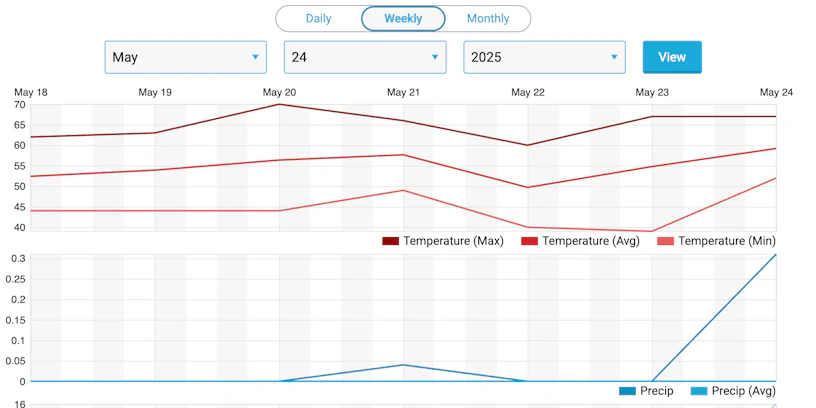
Additionally, the Met Office has a helpful ‘weather history’ page, which details major weather events that date back over 20 years – complete with dates and regions affected in the UK.
If sessions are looking extremely good – check it’s not too good to be true
Sometimes, domain visibility can spike for the randomest things – once, one of my clients ranked for song lyrics for about two days (which was completely irrelevant to their business), but it affected their visibility, which skewed our ‘real’ data.
My advice is to dig a little deeper and don’t always just take visibility at face value – if it looks too good to be true, explore the causes behind the visibility surge thoroughly – oftentimes, it is.
Final thoughts
There are a whole host of other factors that could be at play when it comes to reporting on your performance. There is also a lot of nuance with reporting for different types of industries, and subsequently, what sort of things we should look out for when we pull together these insights, but we’ll leave you with a final point:
It is imperative that everyone in the marketing team talks to each other. This means that SEO, Paid Media, Strategy, Digital PR and Digital Experience teams, need to have a shared ‘hub’ of information that can be used to tell stories with data.
Share marketing calendars, share dates that TV adverts or billboards are going live – annotate your GA4 and Google Search Console dashboard with any information or updates – it makes for a well-connected view on what’s really happening with the data.
One last tip
To take things one step further and understand media effectiveness and how each channel works together, look into media mix modelling, which helps you to determine how different media channels contribute towards achieving the desired marketing goals and uses this to provide an optimal budget distribution. It works by analysing historical data on various media channels and their impact on KPIs. It utilises collected data on media spend, KPIs such as conversions and other context variables such as events, trends or seasonality.
We work closely with businesses and in-house marketing teams to ensure we’re telling insightful stories with data.
Need help with all things SEO and want to feel like you have fellow SEOs with years of experience helping you as an extension of your team? Get in touch today.