Using Google Data Studio is, in theory, a great way of saving time on PPC reporting. Once everything you want in your reports is configured correctly, data within charts will update automatically, allowing you to simply leave it to do its thing while you work hard on improving results.
When reporting for clients with unconventional or variable targets, however, out of the box Data Studio configurations may be insufficient, seemingly forcing you back to more manual reporting methods which take up your precious time.
Let’s say that your client has 5 different campaign areas, each with different traffic, spend, and conversion targets. Each of these campaign areas has 10 different individual campaigns in, and the client wants to know the total number of clicks, total cost, and conversions of each of the 5 campaign areas.
Using Data Studio to report in this way isn’t as simple as it may initially seem. While you can have a table for all of your campaigns, there is no quick way of grouping these by campaign area. Sure, you could use filters to create tables with all of the campaigns within a single area, but this would mean creating 5 separate tables, each with a different filter. This would not be very user-friendly and would take a fair amount of effort to set up.
There is, however, a way to make this much simpler. Creating custom dimensions within Data Studio allows you to group data in many more ways than those offered by the connector which you’re using to pull data into your reports.
Continuing with our previous example, here’s how to create a custom dimension called ‘Campaign Area’. First, open your data source by clicking Resource > Manage Added Data Sources > Edit. Then, click ‘Add a Field’ and you will be shown the screen below.
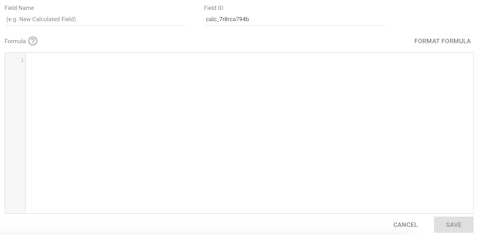
In order to create a custom dimension based on campaign area, you will now need to use a ‘case’ formula to tell Data Studio how to group campaigns based on certain criteria. Using a regular expression match within this will allow you to use your campaign naming customs as the basis for this.
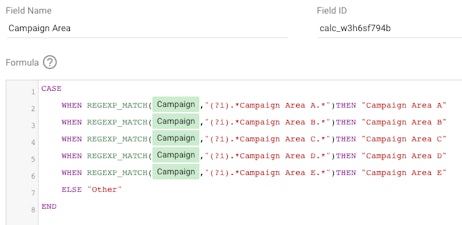
In the above example, the expression which you put within the speech marks inside the brackets is what Data Studio will look for in your campaign names. When it identifies a campaign as matching one of these expressions, it will use the expression after the ‘then’ statement as the Campaign Area for that particular campaign.
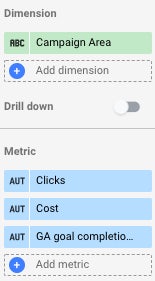
Once you have set up the custom dimension, you will be able to add it to a table which will report on the key metrics for each Campaign Area in a much more concise way than having 5 separate tables. Configuring this in the data tab will look something like the below.
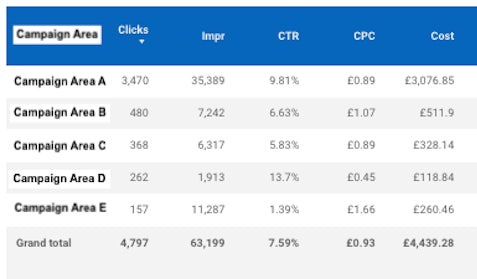
Having set up the table, the final result will be similar to the next screenshot. This is by no means the limit of what you can do with custom dimensions though – combining case formulae with regular expressions on existing dimensions allows you to group data in many other ways, and even define set values for certain groups.
For example, by slightly altering the case formula, you can set benchmarks for different groups of campaign where goals vary by group. In the example below, we have set different CPA goals for branded and generic campaigns which can then be included within tables as a point of comparison.
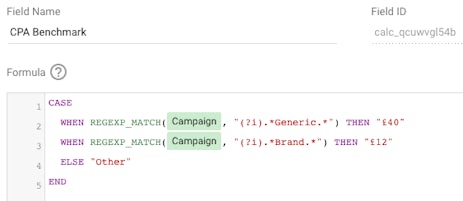
The result is the following table:

Using Google’s list of functions supported by Data Studio’s custom fields, you can configure dimensions in a huge number of different ways to meet your clients needs. If you are interested in how we at Impression can use our advanced reporting & analytics techniques for you, get in touch with us today.


