The advertising dilemma: The ‘Black Box’ of dynamic ads
Ecommerce and Meta often go hand in hand. You can give Meta a 20,000-item catalogue and a budget – and with its AI-powered Advantage+ campaigns – it’ll try to pair the right person with the right product, whether that’s a new customer or someone who’s already viewed those products before.
But what’s actually happening inside that ad? And is there a way to optimise this ‘black box’ Dynamic Product Ad (DPA) format?
Advertisers can see ad-level performance, but have no platform-native insights on which specific products are being shown, clicked, or ignored within a broad DPA.
Is the algorithm making the right decisions?
That’s exactly the question we wanted to answer.
There are three common traps brands fall into:
- Over-segmentation – brands that want more insight break apart their catalogue into niche product sets with tons of DPAs
- Pros – you can give each ad a bespoke name, which tells you exactly what’s being served. Nice!
- Cons – this reduces data density and can kill ROI. There’s also a tendency to try to predict which audiences will respond to which products, which is no longer effective for most brands since Meta’s improved Andromeda updates
- Convoluted reporting – brands try to infer what products Meta is prioritising by pairing GA4 session data (sessions by product) to Meta ads data (the campaigns/ads that sent these users)
- Pros – enables some analysis without falling into the ‘over-segmentation’ pitfall
- Cons – time-consuming to set up, and incomplete. This method doesn’t tell us anything about product-specific engagement within Meta – we would only be guessing at click-through-rate, spend and impressions.
- “Set it and forget“ – brands give up all control and let Meta take the wheel
- Pros – avoids over-segmentation issues
- Cons – There’s a big risk in trusting the algorithm. You might be pushing products that get high impressions but low sales, effectively burning your budget and losing efficiency.
Trying to infer performance and make decisions from Meta Ads Manager UI data is a risk. Many marketers are still not confident in AI-powered campaigns – if this applies to you, you may wish to read this whitepaper before carrying on.
In my role at Impression, we created our Dynamic Product Explorer (DPEx) to solve this challenge – but fear not, I can walk you through the exact steps so you can do the same for your brand.
Our pilot client for DPEx was a major bathroom retailer investing heavily in DPAs within conversion campaigns.
Let’s go through the three phases in our journey to overcoming this ecommerce challenge – so you can recreate.
Phase one: Surfacing engagement data
The first stage in DPEx was visibility – understanding what was happening now within these ‘black box’ DPA formats.
As I said above, Meta doesn’t directly report which specific product led to a specific purchase within a DPA in the Ads Manager interface. It’s simply not an available breakdown in the same way that age, placement etc. are offered.
But the good news is that a treasure trove of insight is buried in the Meta APIs:
- Meta Marketing API (specifically the Insights API) is the main API we use to get all ad performance data. It’s how we’re pulling the key metrics like spend, impressions, and clicks for each ad_id and product_id.
- Meta Commerce Platform API (or Catalogue API), this API provides the list of all product_ids and their associated details (like name, price, category, etc)
By joining these two APIs, we can extract vital data, broken down by product, with their specific clicks and impressions.
We collaborated with our Media Solutions colleagues to pipe this data into our data warehouse (we use BigQuery, but there are many options out there).
This new, combined dataset was then visualised in a Looker Studio report template. Again, other options are available. To make sense of the data, we needed an easily navigable report, rather than pages of raw data. We built the following visualisations:
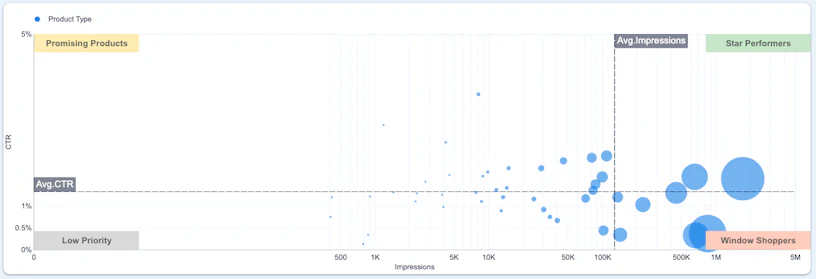
Product scatter chart – separating each product into four distinct categories:
- ‘Star performers‘: High impressions and high clicks.
- ‘Promising products‘: Low impressions but a high click-through rate.
- ‘Window shoppers‘: High impressions but very low clicks.
- ‘Low priority’: low clicks and impressions
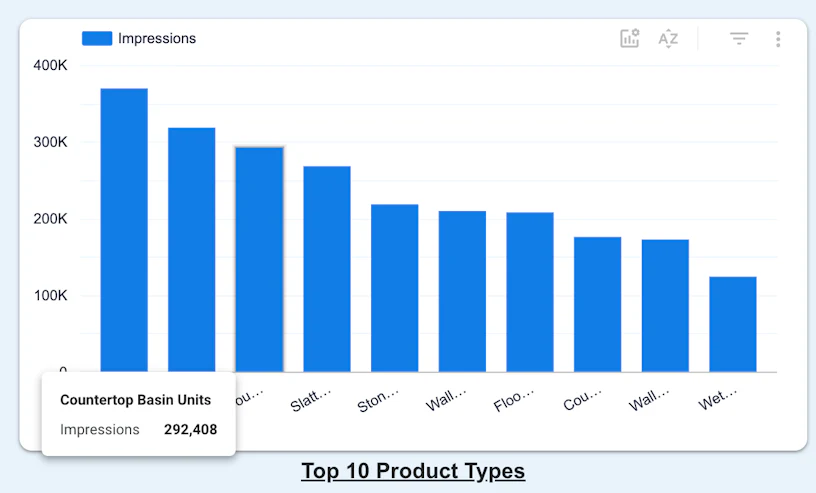
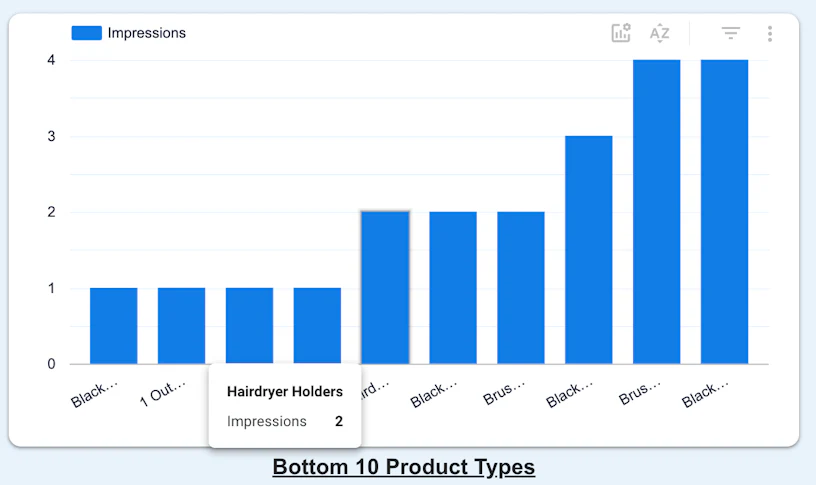
Top/bottom products bar charts – see at a glance the top 10 and bottom 10 products by engagement.
Product details table – view detailed metrics for each product.
This could all be filtered by product name, product type, availability, and any other metrics we wanted (colour, price, etc.)
This gave us our first-ever view of the DPEx report – product-level ad engagement!
Even with just engagement data, this report provided value:
- Creative – we used the data to improve creative briefs
- For our bathroom client, it was interesting to see how much Meta was pushing non-white products (orange sinks, green baths) – despite the fact that 95% of their product sales are traditional white variations.
- We hadn’t prioritised these products initially, but have now created lots more video and creator content featuring these highly clickable variations
- Product segmentation – We can now build powerful, data-driven product sets based on real engagement metrics
- For example, we tested showing only our most engaging ‘Star Performer’ products in feed-powered collection ads in our upper funnel campaigns. In these campaigns, the algorithm has fewer signals to optimise towards, so a broad product set improved as a result.
- For example, we tested showing only our most engaging ‘Star Performer’ products in feed-powered collection ads in our upper funnel campaigns. In these campaigns, the algorithm has fewer signals to optimise towards, so a broad product set improved as a result.
- Efficiency – this automated a complex analysis that was previously unwieldy and time-consuming
Crucially, for the first time, we had enough evidence to challenge Meta’s ‘best practice’ of using the widest possible product set.
Pitfalls & key considerations
However, this work only went so far. There were some key things missing that just tapping into Meta’s API won’t solve:
- Engagement vs. Conversions: The major downfall with this is that product-level breakdowns are only available for clicks and impression data – not revenue or conversions. The “Window Shoppers” category, for example, identifies products that get low clicks, but we couldn’t (in this phase) definitively say they don’t lead to sales.
- Context is key: This data is a powerful new diagnostic tool. It tells us what Meta is showing and what users are clicking, which is a huge step forward. The why (e.g., “is this high-impression, low-click item just a high-value product?”) still requires our team’s analysis
Phase two: Evolving Meta engagement data with GA4 revenue data
We knew the above Meta-only data just explores one part of the journey. To evolve, we needed to join with GA4 data to find out what customers are actually buying after they’re interacting with our feed-powered dynamic product ads.
Instead of relying on platform-modelled conversions, we grabbed data from GA4 specifically for purchase events. This gave us the hard numbers: the revenue and units sold for every transaction.
The crucial key here was getting this data by the item ID, as this is what we used to connect our “profit” data back to the “engagement” data from Meta.
Pitfalls & key considerations
Joining Meta and GA4 data sounds easy enough – but there were some key blockers to overcome. Our first two were hygiene-focused:
- Clean data. The whole model breaks if your Meta ID doesn’t cleanly match your GA4 IDs. You must ensure your product catalogues and your GA4 tagging are perfectly aligned before you start.
- UTM discipline. To properly link a purchase in GA4 back to a specific Meta ad, we needed to capture the ad_id via your UTM parameters. This ad_id is the magic bridge that lets us join the two datasets.
However, the last one was harder to overcome – attribution issues. The GA4 data will almost always show lower conversion numbers than Meta’s UI.
This is because Meta often ‘over-credits’ – it benefits from longer attribution windows, including view-through conversions, and it gives itself full credit for each conversion it measures (rather than spreading out across multiple channels).
GA4, however, often ‘under-credits’ channels like Meta. It uses data-driven attribution to try to give credit to multiple touchpoints – but it’s unable to completely reflect user journeys – meaning GA4 doesn’t easily recognise when a user has interacted with ads before purchasing, and credit accordingly.
Although we’d love to get a 1:1 match from each product purchase back to the specific product interacted with on Meta, neither platform can easily provide this insight. There is still value in finding the relative insights and trends.
Here’s an example:
- Meta’s UI: Reported our ‘Luxury Freestanding Baths – Green’ product is our top performer last month, with high volumes of clicks and impressions in our dynamic ads.
- The Problem: When we joined our GA4 data, we saw no sales for that specific bath last month, at all, from any channel! This is where, before we might’ve panicked and excluded the product from our catalogue to ‘save spend’, and this is the pitfall.
But, by looking at all items purchased in those GA4 sessions that originated from the ‘Luxury Bath – Green’ product, we discover that many users who clicked the bath went on to convert but bought the white variation instead.
The Actionable Insight: The ‘Luxury Bath’ ad wasn’t a failure; it was a highly effective halo product – drawing in aspirational customers who then convert to buy other products.
We can then confidently commission creator content, focusing on this bath to draw in new users even if we know users are likely to buy a different colour when it comes to purchase.
Phase three: Performance-enhanced feeds
Once we have this data at your fingertips, the temptation is to focus on it purely for insights and data.
The next level was even better – using this data to create automated supplementary feeds. Using those same four product categories from our scatter charts, we created automatic logic to manufacture new product sets and conducted the following tests:
- ‘Window Shoppers’: (High impressions, low clicks/sales). Feed these into an exclusion set to understand if efficiency improves when we remove them from the feed.
- ‘Promising Products’: (High CTR, high CVR, low impressions). Feed these into a scaling set with more budget to understand if demand is hidden.
- ‘Star Performers’: (High impressions, high clicks). Feed these into a retargeting set to recapture engaged users with our signature ranges.
Pitfalls & key considerations
The tests above are simply examples of hypotheses. However, your mileage will vary! We strongly recommend testing these use cases strategically in order to understand whether it adds to your overall performance.
Is your brand ready to break out of the ‘Black Box’?
Breaking out of Meta’s “Black Box” isn’t just a technical exercise; it’s a strategic must-do for e-commerce advertisers. The journey moves from surfacing basic engagement data (Phase one) to joining it with sales data for true, profit-driven insights (Phase two), and ultimately, to automating your strategy with performance-enhanced feeds (Phase three).
This is how you move from trusting the algorithm to challenging it with evidence. If you’re a decision-maker wondering where to start, here are the three questions to ask:
- “Can you show me which specific products in our catalogue are being prioritised by Meta?”
- “Are our Meta product_ids and GA4 item_ids identical?”
- “Are we capturing the ad.id in our UTM parameters on every single ad?”
If the answers to these questions are ‘I don’t know,’ you’re probably still operating inside the black box. Breaking it open is possible – it just requires the right data, the right technical joins, and the will to finally see what’s truly driving performance. Get in touch with our team.