Share of Search (SoS) is a metric introduced by Les Binet that shows the frequency of organic search queries that include your brand’s name vs. those of your competitors and/or other brands within your industry. The ultimate goal of SoS is to indicate to marketers how well their campaigns are performing and help forecast the demand for your brand.
The calculation takes your brand’s organic searches and divides it by the total category brand searches to get to your Share of Search.

Why is Share of Search useful?
Share of Search is an indicator of Market Share
An increase in your brand’s search share signals greater visibility and higher consumer engagement, as more people discover your brand organically through search engines. This boost in visibility can drive market share growth, often within six months. Additionally, search share is a valuable tool for competitor benchmarking, allowing you to spot emerging threats by tracking any gradual or sudden increases in their share of search.
It enables tracking effectiveness of marketing activities
SoS is a fast way to gauge the effectiveness of brand awareness campaigns. It helps you quickly assess whether your marketing efforts are sparking consumer interest. By comparing your SoS trend with your campaign timeline, you can see if the campaign is successfully boosting visibility.
Share of Search can be used to forecast consumer demand
Share of Search serves as a valuable, real-time indicator of consumer demand, helping brands monitor market shifts. While it doesn’t capture detailed product-level searches, it offers insights into overall interest in your brand. Tracking SoS trends alongside key metrics like sales and revenue can improve demand forecasting and strategic decisions.
SoS also sheds light on brand resilience and consumer consideration. A steady or rising SoS typically signals strong brand demand and shows how often consumers view your brand as a preferred choice
Why is Share of Search a cost-effective way to measure brand health?
Share of Search tracking offers a budget-friendly alternative to traditional methods like surveys or focus groups. Free tools like Google Trends provide valuable insights without the expense of in-person research. Because SoS data is collected passively, it doesn’t disrupt consumers or require their participation, making it less intrusive. This approach also reduces response bias, giving brands a more accurate view of organic interest and sentiment.
Limitations of Share of Search
However, Share of Search has its limitations. It reflects search interest in your brand but doesn’t reveal the reasons behind that interest, which could be either positive or negative. This can lead to confusion when making forecasts. To gain a fuller understanding, it’s essential to complement SoS data with qualitative insights.
Calculating Share of Search easily using Google Trends
- Finalise Your Competitor Set
- Google Trends allows you to compare up to five search queries at a time (including your brand).
- If you have more than five competitors, prioritise the strongest brands and rotate the remaining ones.
- Export the Data
- Export the Google Trends data into a spreadsheet using Google Sheets or Excel.
- Organise the data in a table for easier calculation.
- Calculate the Average Index
- For each query, calculate the average index score from the data. This helps normalise the results.
- Apply the SoS Formula
- Use the SoS formula to determine your brand’s Share of Search.
How to Calculate the Average Index Score
- Gather data from Google Trends
- After finalising your competitor set and entering queries in Google Trends, export the data as a CSV or copy it into a spreadsheet (Google Sheets or Excel).
- The data will show an indexed score (0 to 100) over a specific time period for each brand or search term.
- Organise the data
- Create a column for each search query (including your brand) and input the corresponding index scores.
- Calculate the average
- For each query, sum the index scores across the time period.
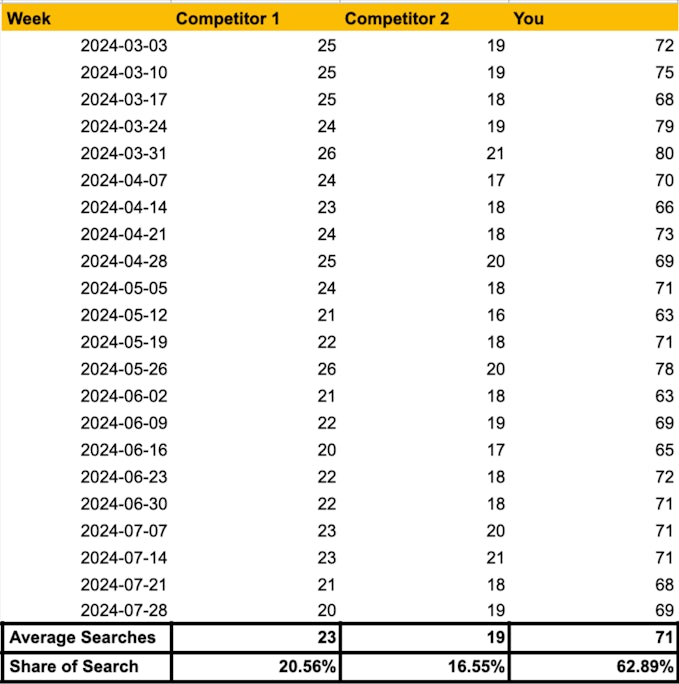
- Divide the total by the number of data points (e.g., weeks or months tracked).
This gives you the average index score for each brand.
Example:
| Week | Brand A | Brand B | Brand C |
|---|---|---|---|
| 1 | 80 | 60 | 40 |
| 2 | 90 | 70 | 50 |
| 3 | 85 | 65 | 45 |
- Sum (Brand A): 80 + 90 + 85 = 255
- Average (Brand A): 255 ÷ 3 = 85
Repeat for each brand to compare results.
Refer to the example below for a clearer understanding!

Building automated Share of Search reports
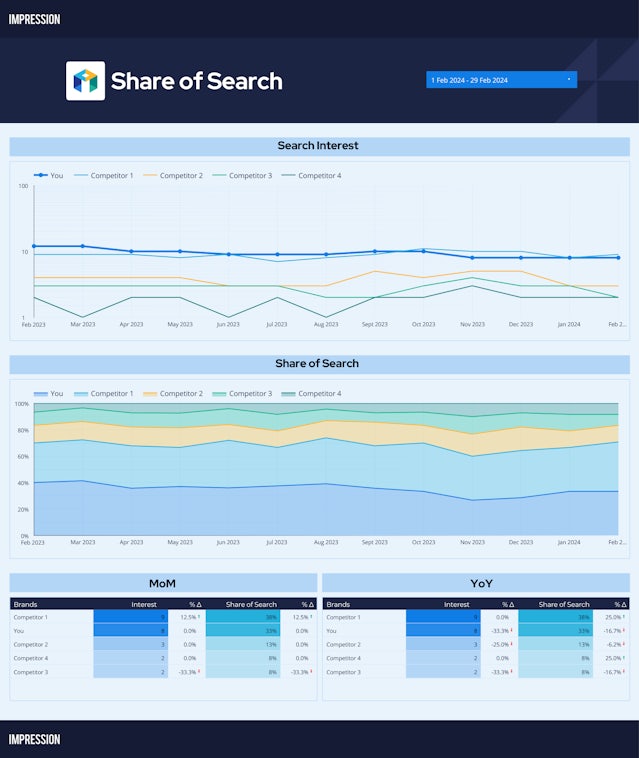
Automation platforms can simplify the process of tracking Share of Search (SoS), saving time and providing real-time insights. Tools like Adverity can extract and load search data into a data warehouse, creating a seamless pipeline that feeds into Google Sheets or dashboards like Looker Studio. This setup ensures centralised, up-to-date tracking of brand performance.
Key steps for building automated reports:
- Data integration: Automatically pull search data into a central repository.
- Dashboard updates: Feed the data into live dashboards for continuous monitoring.
- Reporting cadence: Refresh reports frequently for accuracy and conduct reviews to identify meaningful trends.
Need assistance setting up these dashboards? Reach out to our measurement team.
When looking at Share of Search, focus on trends, not just numbers:
- Long-term trends: Prioritise overall trends rather than exact figures to gain a more reliable view of performance.
- Handling fluctuations: Be aware that tools like Google Trends can show slight variations due to data updates or shifts in search behaviour.
Focusing on broader patterns provides a clearer picture of brand demand, helping identify significant market changes and informing strategic decisions. Below, you can see an example of an automated dashboard we’ve created.


